vd-pge
This is an old revision of the document!
Table of Contents
Analyzing PG&E data with VisiData
PG&E CSVs come with 5 rows of metadata followed by Type, Date, Start Time, End Time, Usage, Units, Cost, Notes columns. Delete the five rows of metadata in a text editor, or use tail to remove them like so:
tail +6 pge_electric_interval_data.csv | vd -f csv -
Then prepare your PG&E data like so:
Set Column Types, Widths, Names, Importance
| Key | Meaning |
|---|---|
| - | Hide columns TYPE, END TIME, UNITS and NOTES |
| = | Create a new column for weekday. Enter “DATE.weekday()” |
| = | Create a new column for weekday name. Enter “DATE.strftime('%A')” |
| ^ | Rename “START TIME” to one word since column names should be one word for Python expressions. |
| C | Go to column mode and… |
| t | Select the DATE and START TIME columns |
| & | Make a new column that merges them |
| q, - | Quit the Column mode, hide DATE and START TIME columns |
| O | Go to options mode and… |
| e | Set disp_date_fmt to %Y-%m-%d %H:%M (or do it in C column mode for the one column.) |
| q | Quit options mode. |
| @!, %, $ | Set DATE_START_TIME to date format and important, USAGE to float, COST to currency |
| = | Add a column, enter COST/USAGE, (Make it float with %) |
| ^ | Rename COST/USAGE to kWh rate |
| H,V and _ | Move and resize the columns. |
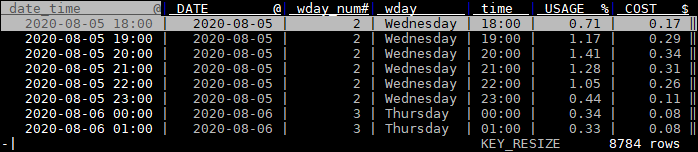
You should end up with a sheet with usable data. Note that @ means “date format”, # means “integer”, % means “float” and $ means “currency”. Also note that we haven't set aggregator types yet. We'll use those for frequency tables.
View average usage by hour of day
| Key | Meaning |
|---|---|
| - | Hide all columns, leaving only time, USAGE, and COST |
| + | On USAGE and COST, set aggregator type to… say, avg for average. |
| F | On the time column, tap F to get a frequency table. |
| [ | The frequency table is sorted on the new aggregations, on time column, use [ to sort by time again. |
| - | Remove the new count column. |
| C, e, “%H:%M”, q, @! | Go to column mode, set time column format to %H:%M, exit column mode, set time to date format. |
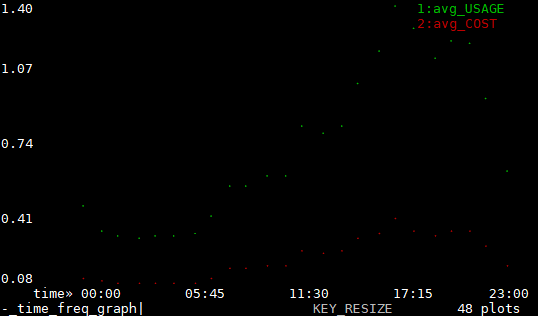
| g. | Display a graph with all visible columns. |
| -, + | Zoom in and out of the graph. |
| q, q | Quit the graph, quit the frequency sheet |
| C, t, ge, 8 | Column mode, toggle date_time, DATE', wday_num, wday, edit width to 8, to see these columns again. |wday_num, time, USAGE, and COST'' |
Select Rows to Analyze
| Key | Meaning |
|---|---|
| | | On DATE_START_TIME column, select by regex, like “-11-” for November |
| “ | To open a new sheet with just those selected rows. |
| q | Quit the new sheet mode. |
| Key | Meaning |
|---|---|
| z| | select rows matching Python expr “DATE_START_TIME [-3:] == '-07'” |
| ” | To open a new sheet with just those selected rows. |
| q | Quit the new sheet mode. |
Visualize Data
| Key | Meaning |
|---|---|
| . or g. | Select columns to graph them. Notice rate changes. Notice times of high use. |
| +, - | Navigate with hjkl, zoom in and out (more) |
vd-pge.1628613896.txt.gz · Last modified: 2023/04/12 20:44 (external edit)